

Key findings
- 26.2% of checks returned a stock warning. 20.3% showed low stock and 5.9% showed the product out of stock. (n = 598,231 checks, April 1 to August 15, 2026)
- 89.1% of stock problems were location-specific. When a product hit a stock warning, it almost always hit some locations while others stayed in stock on the very same day. (n = 468 multi-location products with a warning, 30 days ending August 15, 2026)
- Low stock is a problem before zero is. In a client analysis, conversion rate and Buy Box ownership both slipped during low-stock periods, not just during stockouts.
- Over 30 days, 59.6% of products hit a warning. 13.0% went fully out of stock at least once and 53.2% dropped into low stock. (n = 1,774 products, 30 days ending August 15, 2026)
Five years ago you could hire someone to manage Amazon PPC and they would handle bids, budgets, keywords, and campaign structure. That was enough. It isn't anymore. A good Amazon PPC marketer today is just a good Amazon marketer, which means looking at the full P&L per product, at conversion rate, at fees and refunds and logistics.
And stock. Stock is the one that keeps getting left out of the conversation, and it might be the most expensive omission on the list. So we went and measured it.
What we measured
Every figure in this post comes from Buy Box Checker's own database, queried on August 15, 2026. Each check reads a live Amazon product page from a specific delivery location and records who owns the Buy Box, at what price, and what the stock message says.
The sample
- Data pulled
- August 15, 2026
- Check-level window
- April 1 to August 15, 2026
- Checks analyzed (n)
- 598,231
- Product-level window
- 30 days ending August 15, 2026
- Products tracked (n)
- 1,774
- Of those, multi-location (n)
- 752
- Distinct ASINs
- 1,775
- Product-location pairs
- 8,397
- Delivery locations
- 116, across 11 US states
- Marketplaces
- amazon.com, .co.uk, .ca, .ie
These are the numbers as they stood on the pull date. Buy Box Checker adds roughly 6,900 checks a day, so the sample grows and the rates will move a little as it does. We have not smoothed, weighted, or excluded outliers.
Stock status is read directly from the page text Amazon shows a shopper, phrases like "Only 5 left in stock" or "Currently unavailable", then normalized into three buckets: in stock, low stock, and out of stock. We are not estimating inventory, we are recording what a shopper in that location would have seen.
One note on the denominator. We began capturing stock text in April 2026, so checks before that date have no stock field and are excluded. Including them would understate every rate in this study.
How often does an Amazon listing show a stock warning?
26.2% of checks returned a low-stock or out-of-stock warning. That breaks into 20.3% showing a low-stock message such as "Only 5 left in stock" and 5.9% showing the product fully unavailable. Put another way, roughly one in every four times we looked at an Amazon product page, we found inventory trouble of some kind.
Stock state across 598,231 Amazon checks
Source: Buy Box Checker first-party data, 598,231 checks, April to August 2026.
The rate is stable enough to plan around. Across five consecutive months it never left a band between 24% and 29%, on a base of roughly 580,000 checks. This is not a seasonal blip or a single bad month dragging an average.
| Month | Low stock | Out of stock | Combined |
|---|---|---|---|
| April 2026 | 23.1% | 4.4% | 27.5% |
| May 2026 | 18.6% | 5.9% | 24.5% |
| June 2026 | 21.6% | 6.9% | 28.5% |
| July 2026 | 17.9% | 6.2% | 24.1% |
Shift from checks to products and the picture gets worse. Over a single 30-day window, 59.6% of the 1,774 products we track hit a stock warning at least once. 13.0% went fully out of stock somewhere, and 53.2% dropped into low stock. More than half of a typical catalog runs into an inventory problem in any given month.
Why low stock costs you before you ever hit zero
Low stock is not a warning about a future problem. It is the problem, already in progress. This came out of a disagreement with an Ad Badger client who was certain that stock levels had nothing to do with conversion rate, because as far as they were concerned they were in stock.
Our team pulled that client's unit session percentage against their warehouse balance over time. The split was clean. Above roughly 1,600 units in the warehouse, daily sales never dropped below $10,000. Below roughly 1,500 units, daily sales never rose above $9,600. Conversion rate never fell under 3.4% while well stocked and never got above 3.3% while low. Buy Box ownership sat at 99.5% in the healthy period and slipped in the low period.
The product never went out of stock. It just got low, and every metric that matters moved against it. That is the part almost nobody prices in.
The industry name for this is inventory distortion, the combined cost of being overstocked in some places and understocked in others. Research firm IHL Group, which has tracked the problem for 18 years, puts the global cost at $1.7 trillion a year, roughly 6.5% of global retail sales, with out-of-stocks making up about 70% of that total and overstocks the rest.
Your product does not go out of stock everywhere at once
This is the finding that surprised us most. Of the multi-location products that hit any stock warning during our 30-day window, 89.1% had at least one day where one location read low or out of stock while another read in stock at the same moment. That is 417 of 468 products. Across every product-day that carried a warning, 45.3% were split like this.
Restrict it to full stockouts only, which is the stricter test, and the pattern holds: 75.9% of the products that went fully out of stock did so in some locations while others stayed in stock on the same day.
Low stock drives the split far more often than stockouts do. Of the 417 products that showed a location split, 341 were split on low stock and 107 on a full stockout. The geography shows up long before anything reaches zero, which is exactly where a national inventory number tells you everything is fine.
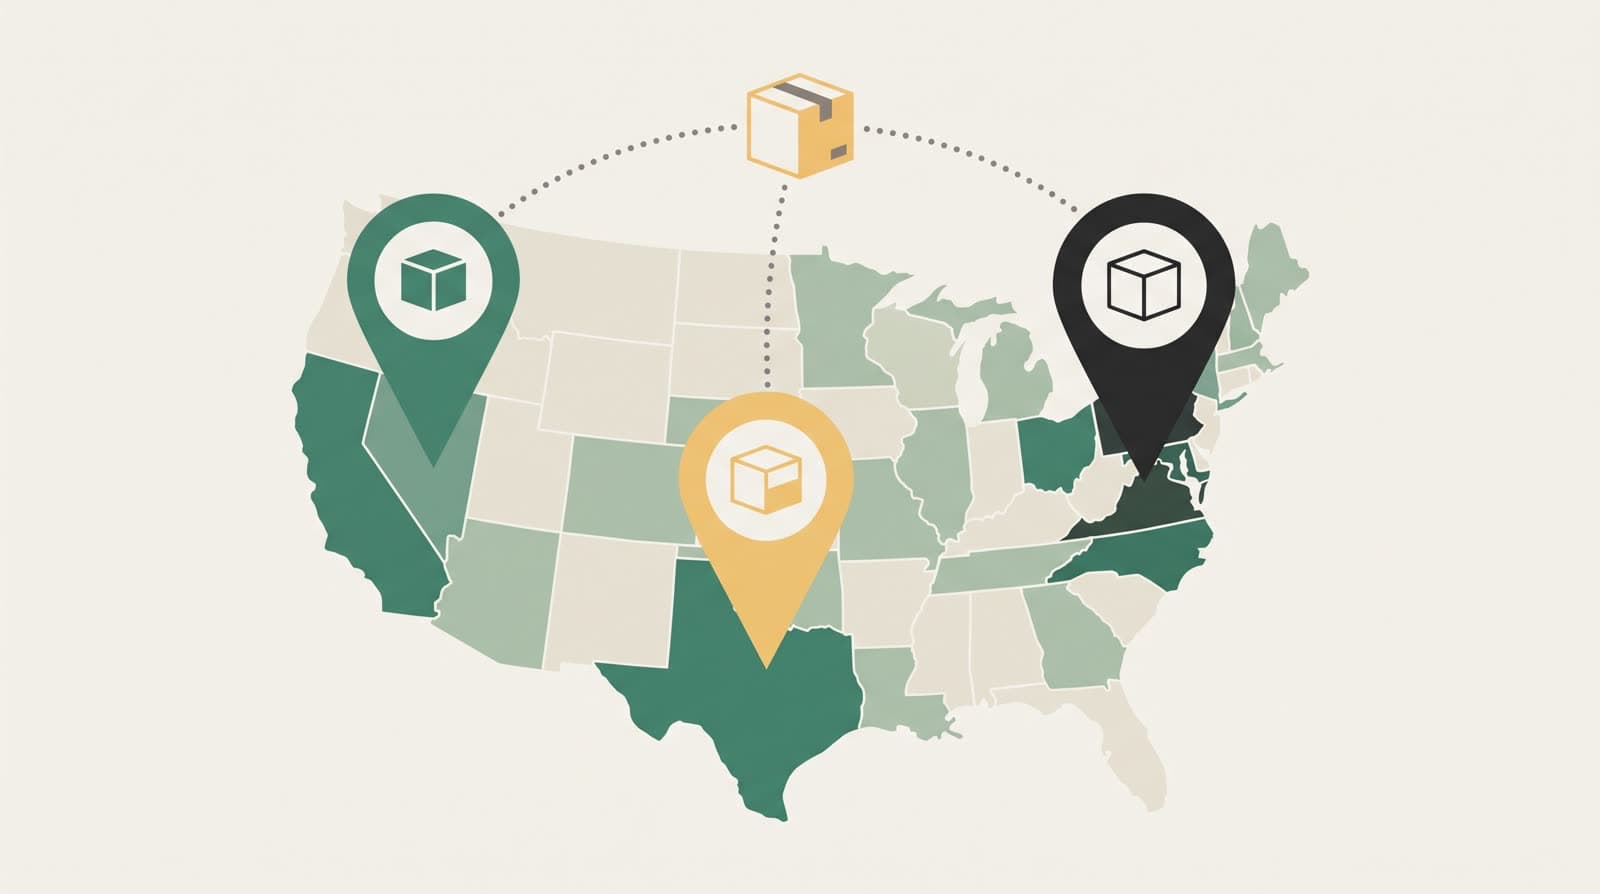
Amazon distributes your inventory across a fulfillment network, so running low nationally rarely means running out uniformly. It means running out in Miami while Seattle is fine. If you check your listing from one place, or trust a national inventory number, that Miami stockout is invisible to you and completely visible to every shopper in Miami.
We see the same pattern in Buy Box ownership itself, which is why multi-location checking exists in the first place. Stock is simply the clearest example of it. Our guide to how the Amazon Buy Box works covers why location changes the answer so often.
What a stockout actually costs
Lost sales are the obvious cost and the smallest one. A stockout charges you in four separate ways, and three of them keep charging after the product is back.

- Direct lost revenue. Demand arrives and finds nothing to buy. If the stockout is regional, you lose that region while your national numbers look survivable.
- Rank decay. Sales velocity drives organic position. Go out of stock and rank falls, then you pay in both time and ad spend to climb back.
- The PPC tax. When you drop out of the auction, competitors get cheaper clicks and more market share. You are subsidizing them, and you keep paying to re-rank afterward.
- Capital lockup. The flip side. In one audit we found products sitting on more than 1,000 days of supply while the top sellers ran dry, which is cash frozen in the wrong SKUs plus storage fees.
In an anonymized audit of an account doing roughly $400,000 a month, about 30% of the catalog was completely out of stock. The worst cases were high velocity, low stock: products selling $16,000 a month with 13 days of cover, $7,600 a month with six days, $5,000 a month with three days. Those are the ones worth catching at 30 days, not at zero.
How to audit your own stock data
You can reproduce most of this analysis yourself in an afternoon. You need three reports, and none of them require a new tool.
- Advertised products report. Advertising console, Products, then download. This gives you sales, ROAS, impressions, and conversions per ASIN.
- FBA inventory health report. Seller Central, Reports, Fulfillment, Inventory Health. Pull ASIN, product name, available, reserved, inbound, days of supply, units shipped, and snapshot date.
- Business report. Detail page sales and traffic by ASIN, which is where unit session percentage lives.
Pull all three across two time frames so you can see movement rather than a single snapshot, then drop them into Claude or the AI tool of your choice and ask it to flag high velocity low stock SKUs, overstocked SKUs above 100 days of supply, and any ASIN whose unit session percentage moved with its inventory balance.
The single most useful output is not the stockout list. It is the restock list. Amazon does not notify you when a product comes back in stock, so the window between a SKU going from zero to available and someone turning the ads back on is pure lost revenue. Watching for that transition is worth more than most bid adjustments.
Turning the signal into campaign decisions
Stock data earns its keep when it changes what your campaigns do. Our data says 13.0% of products go out of stock somewhere each month and 53.2% run low, so this is a recurring operational trigger rather than an occasional fire drill.
Pause or throttle campaigns on ASINs that have stocked out, and do it by location if your structure allows it. Restart quickly on restock. Ease off aggressive bids when a high-velocity product drops into low stock, because you are paying full price for clicks that are about to convert worse anyway. And when a product is healthy and holds the Buy Box, that is the moment to push.
The one thing that does not work is checking by hand. It does not scale past a few products and locations. Buy Box Checker checks every location you track once a day and records any stock warning on the featured offer, so the dashboard shows where stock is running thin. Our automatic Buy Box alerts do not cover stock, so the dashboard is where to look. If you want to see what a loss looks like when it happens, our guide on recovering a lost Buy Box walks through the recovery path.
Methodology
All figures come from Buy Box Checker's own database. Check-level rates cover 598,231 checks with stock data recorded between April 1 and August 15, 2026. Product-level rates cover the 30 days ending August 15, 2026, across 1,774 tracked products.
A product counts as out of stock if any tracked location recorded an out-of-stock message on any check. Split-location figures require one location to read low or out of stock while another reads in stock on the same calendar day, which is a stricter test than comparing across days, and they cover only the 752 products tracked in more than one location. A single-location product cannot show a split, so it is excluded from both sides of that ratio. Locations are checked about once daily, so stock problems that open and close between two checks are not counted. Every rate here is a floor.
Frequently asked questions
How often do Amazon listings show a low-stock or out-of-stock warning?
In our data, 26.2% of checks returned one. Across 598,231 Amazon product checks between April and August 2026, 20.3% showed a low-stock message and 5.9% showed the product fully out of stock. The rate held between 24% and 29% every month.
Does low stock hurt an Amazon listing, or only a full stockout?
Low stock hurts on its own. In an Ad Badger client analysis, daily sales never rose above $9,600 during low-stock periods and never fell below $10,000 while fully stocked. Conversion rate and Buy Box ownership both slipped before the product ever hit zero.
Can a product be out of stock in one location and in stock in another?
Yes, and it is the normal case. Of the multi-location products that hit any stock warning in our 30-day sample, 89.1% had at least one day where one location read low or out of stock while another read in stock at the same time.
Why does Seller Central not show location-level stockouts?
Seller Central reports inventory at the national level, so a product with regional fulfillment gaps still reads as in stock. Detecting the gap requires checking the live product page from different delivery locations, which is what our 8,397 tracked product-location pairs do daily.
What should a PPC manager do when a product goes out of stock?
Pause or reduce spend on affected campaigns, then restart on restock. Amazon sends no restock notification, so the gap between coming back in stock and turning ads back on is pure lost revenue. Out-of-stock periods also erode organic rank, which costs more spend to rebuild.
See one product from several delivery locations
Paste in an ASIN and the Badger checks it from multiple delivery locations, so you can see who holds the Buy Box in each one, at what price, and with what Prime delivery time. Free, and no seller account needed. Stock warnings are not part of the free check. They show in the dashboard once you track a product.
A product by Ad Badger.